

Loading the data
Go to Data → Files and drag in your.xlsx, .csv, or .json file. Larkup detects the structure automatically. Column types, row count, and the data schema are shown before you confirm.
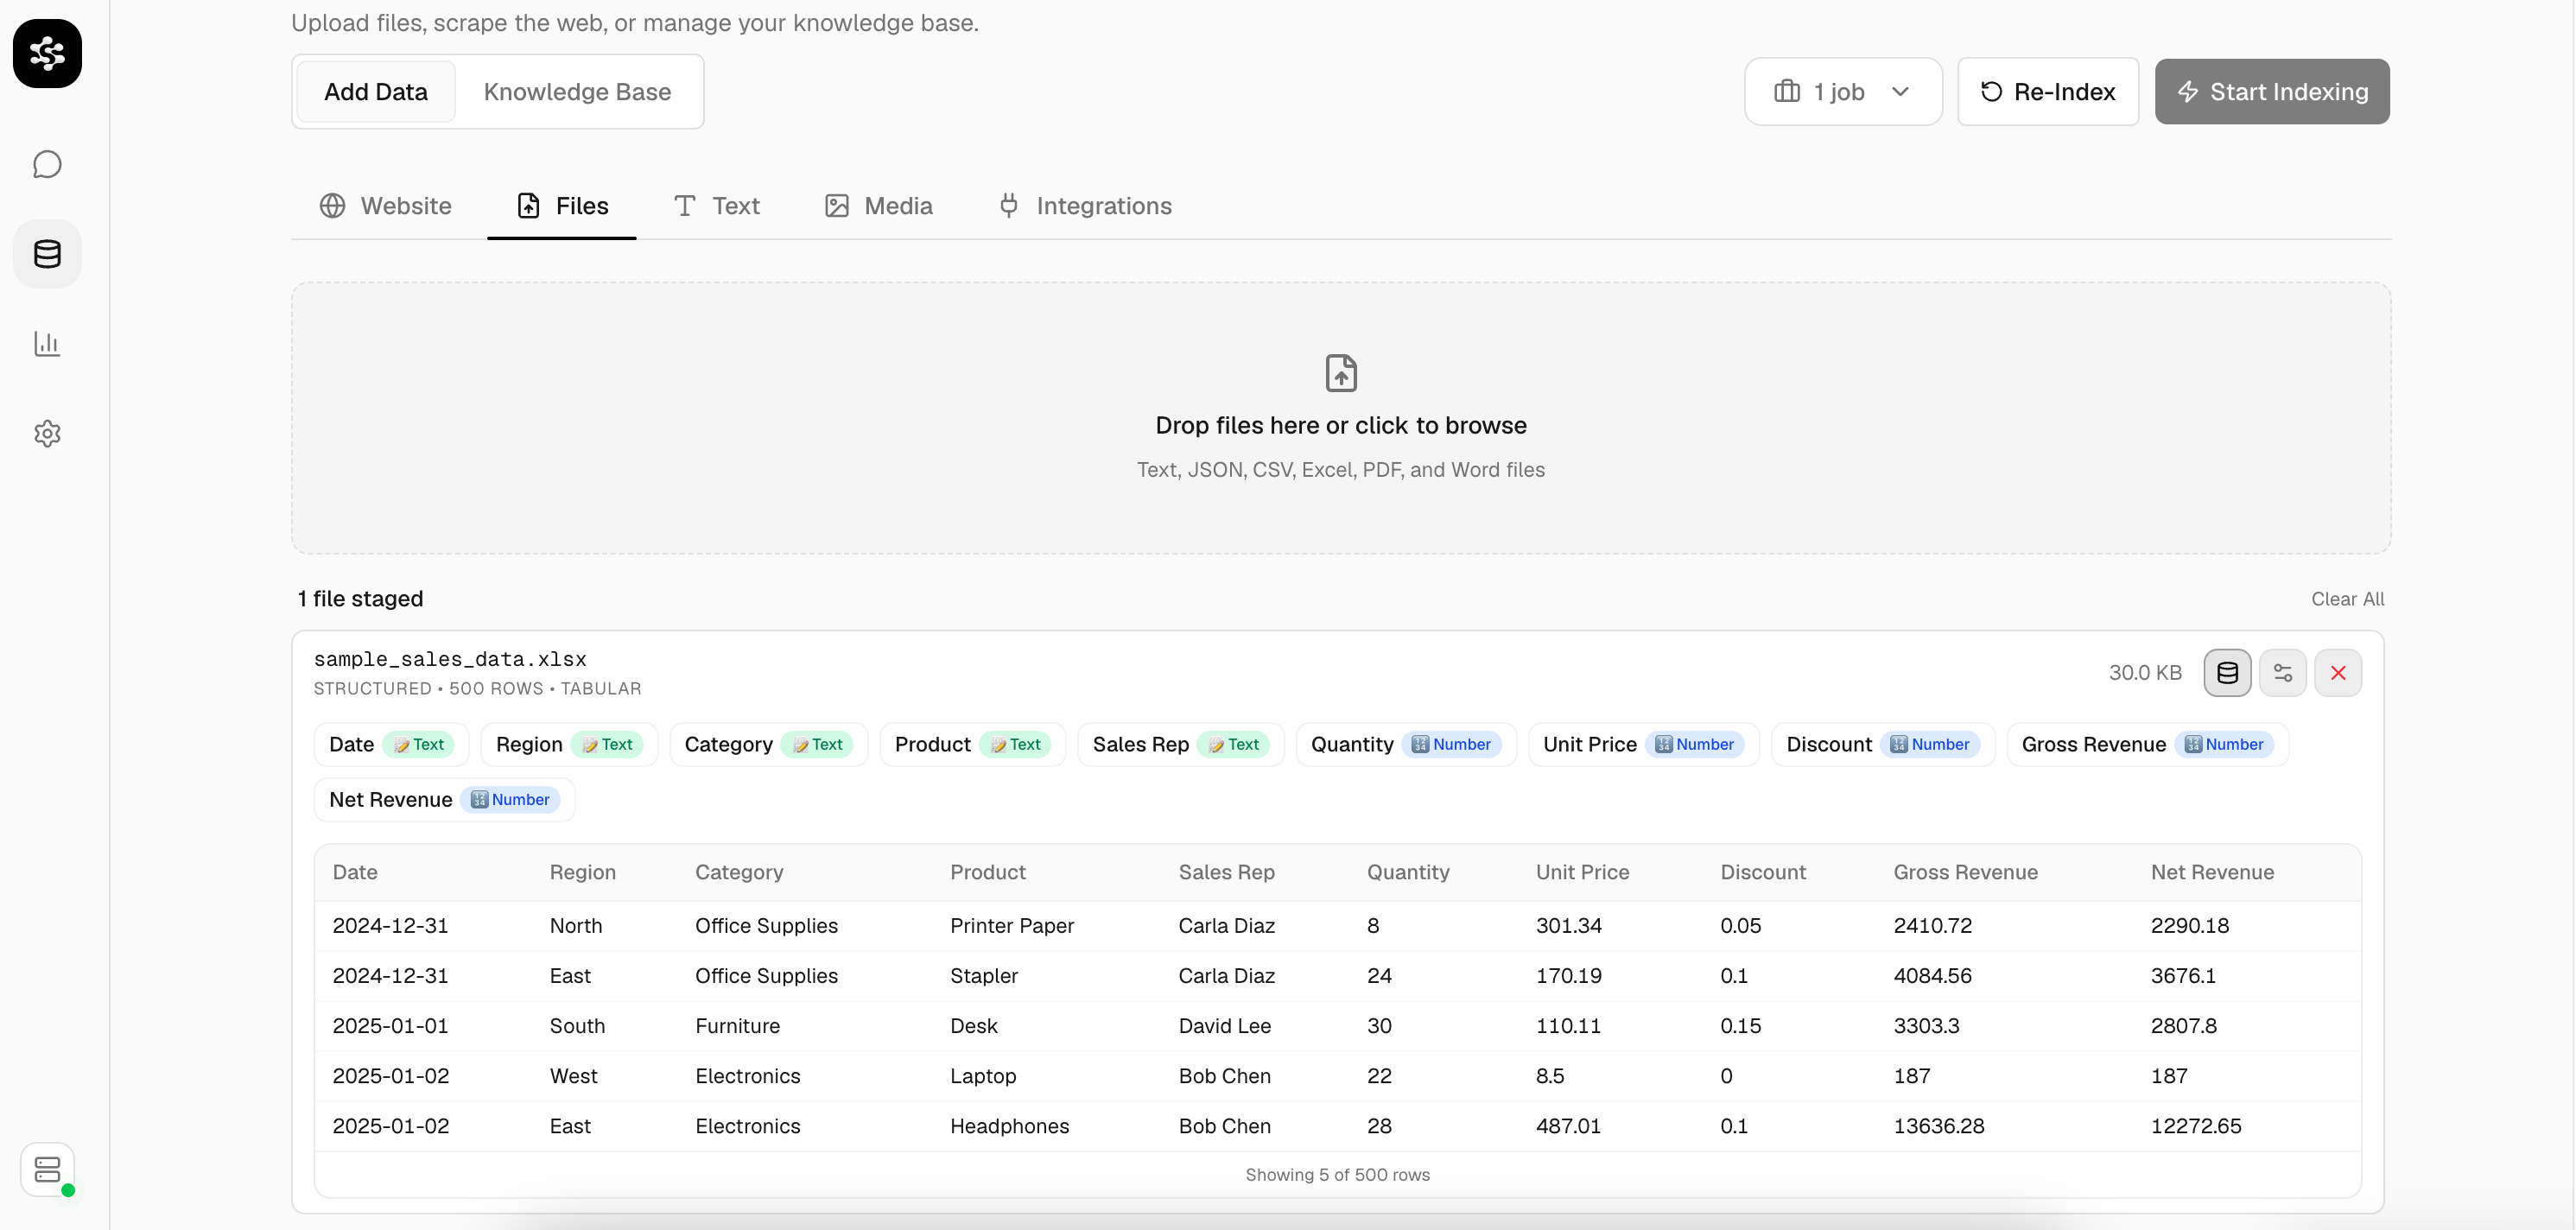
A 500-row Excel file staged for upload with column schema preview
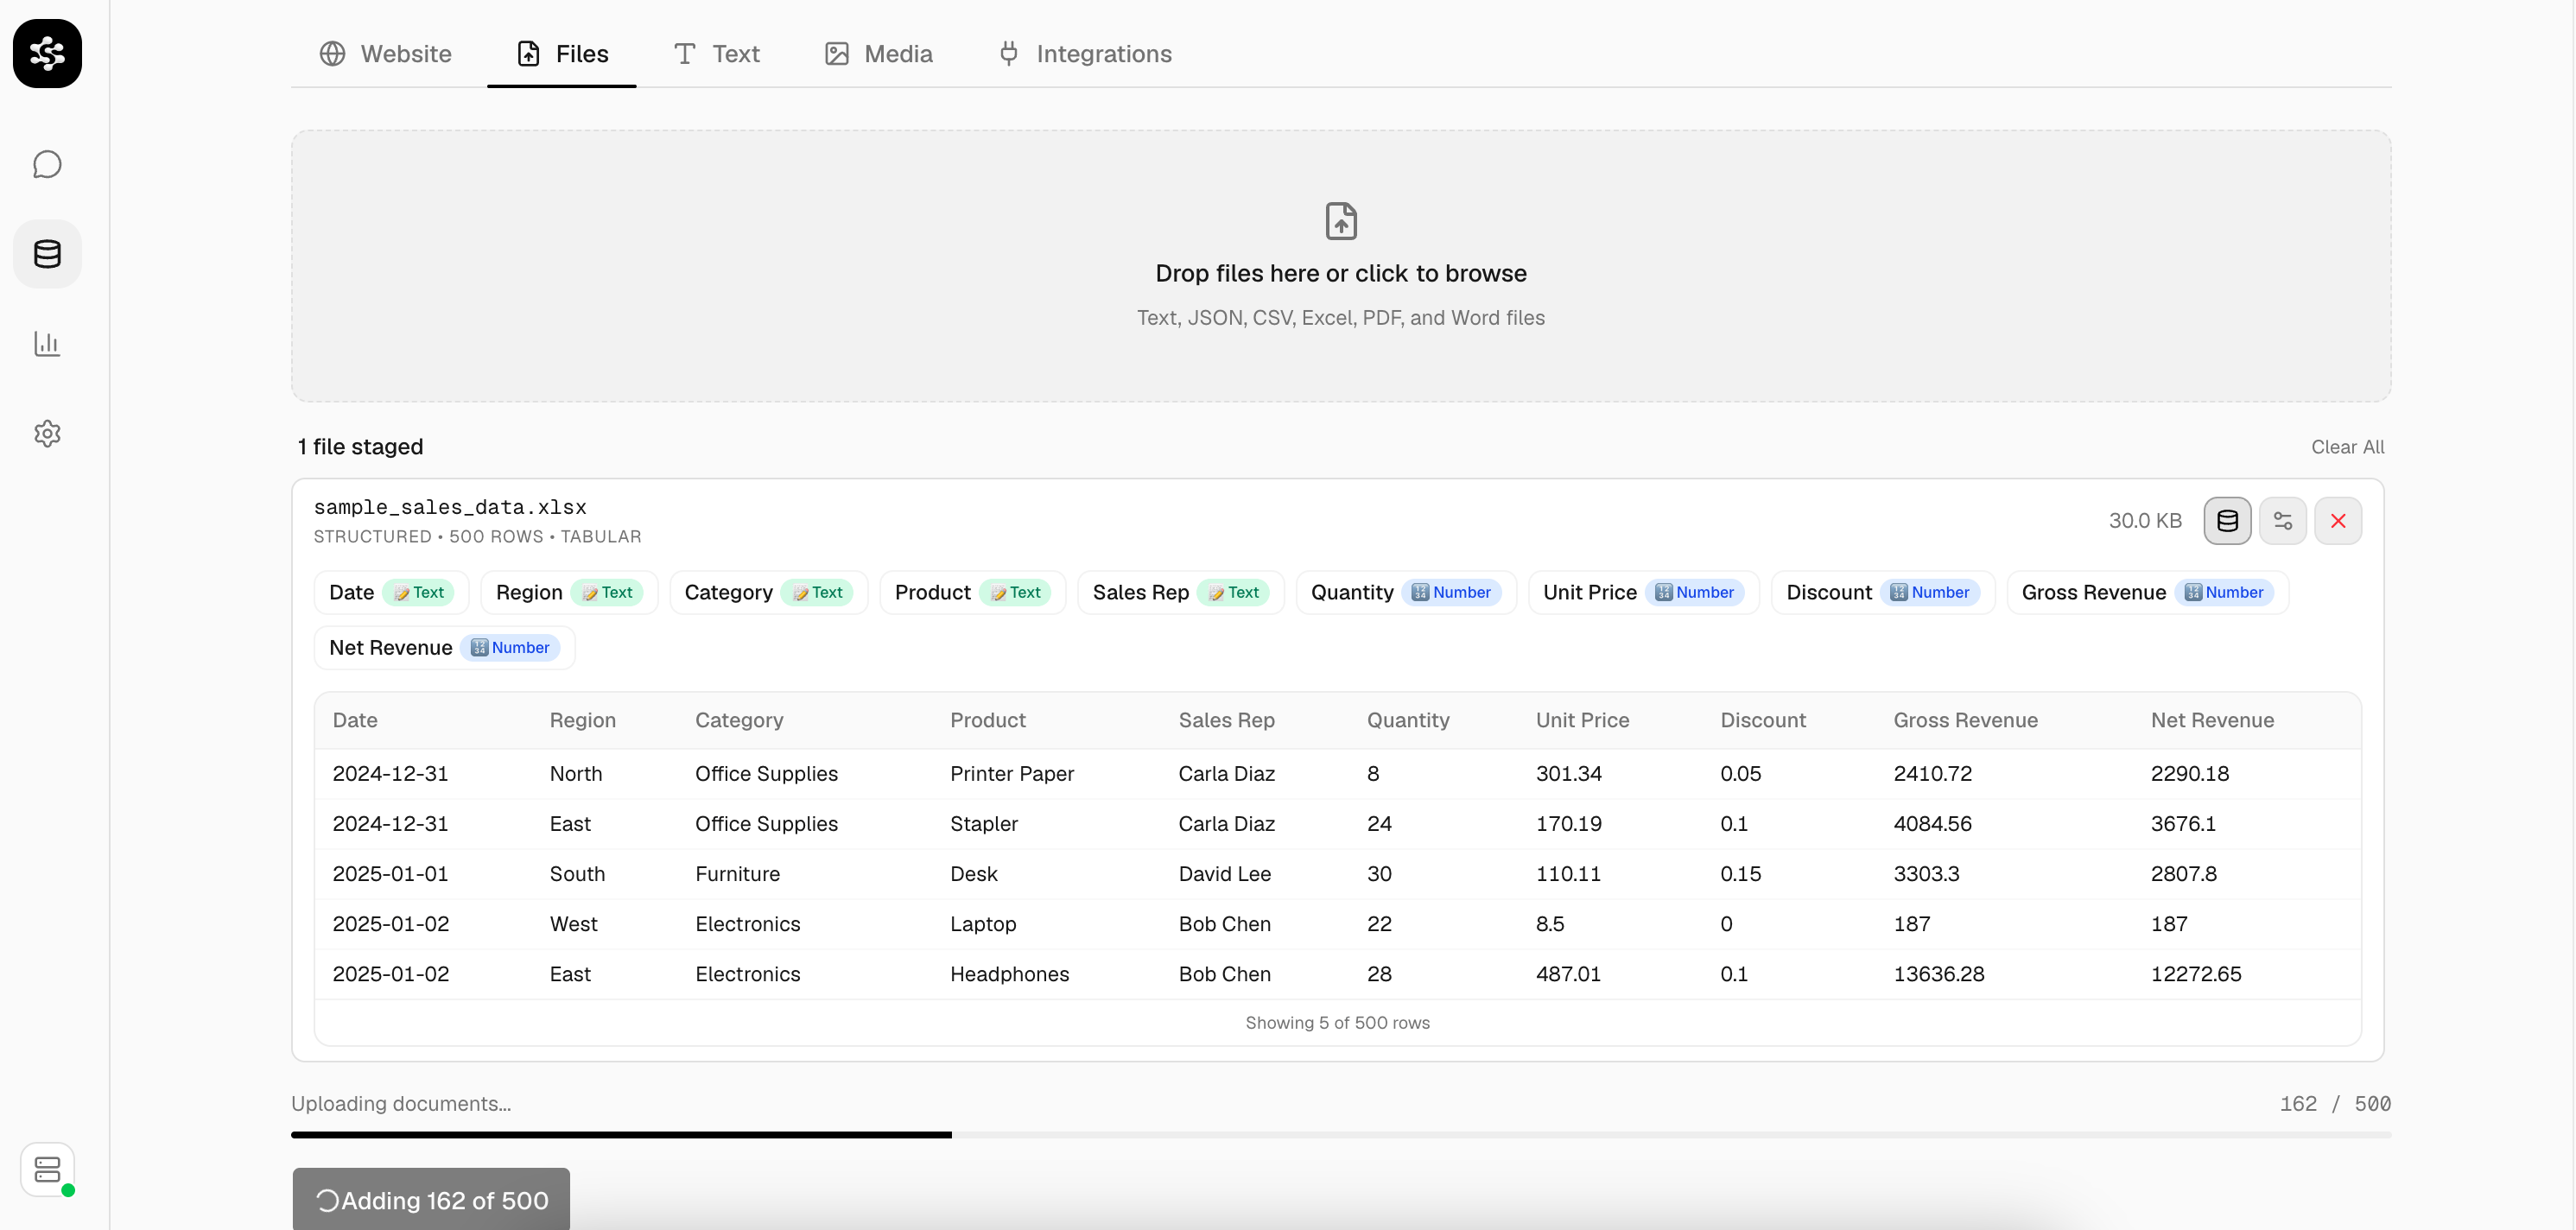
Indexing progress for a structured data file
Asking analytical questions
Once indexed, open Chat and ask anything about the data:“Show revenue by region as a bar chart” “Which sales rep had the highest net revenue in Q1?” “Give me a monthly breakdown of gross sales”Larkup reads the relevant rows, computes the answer, and renders the chart or table inline.
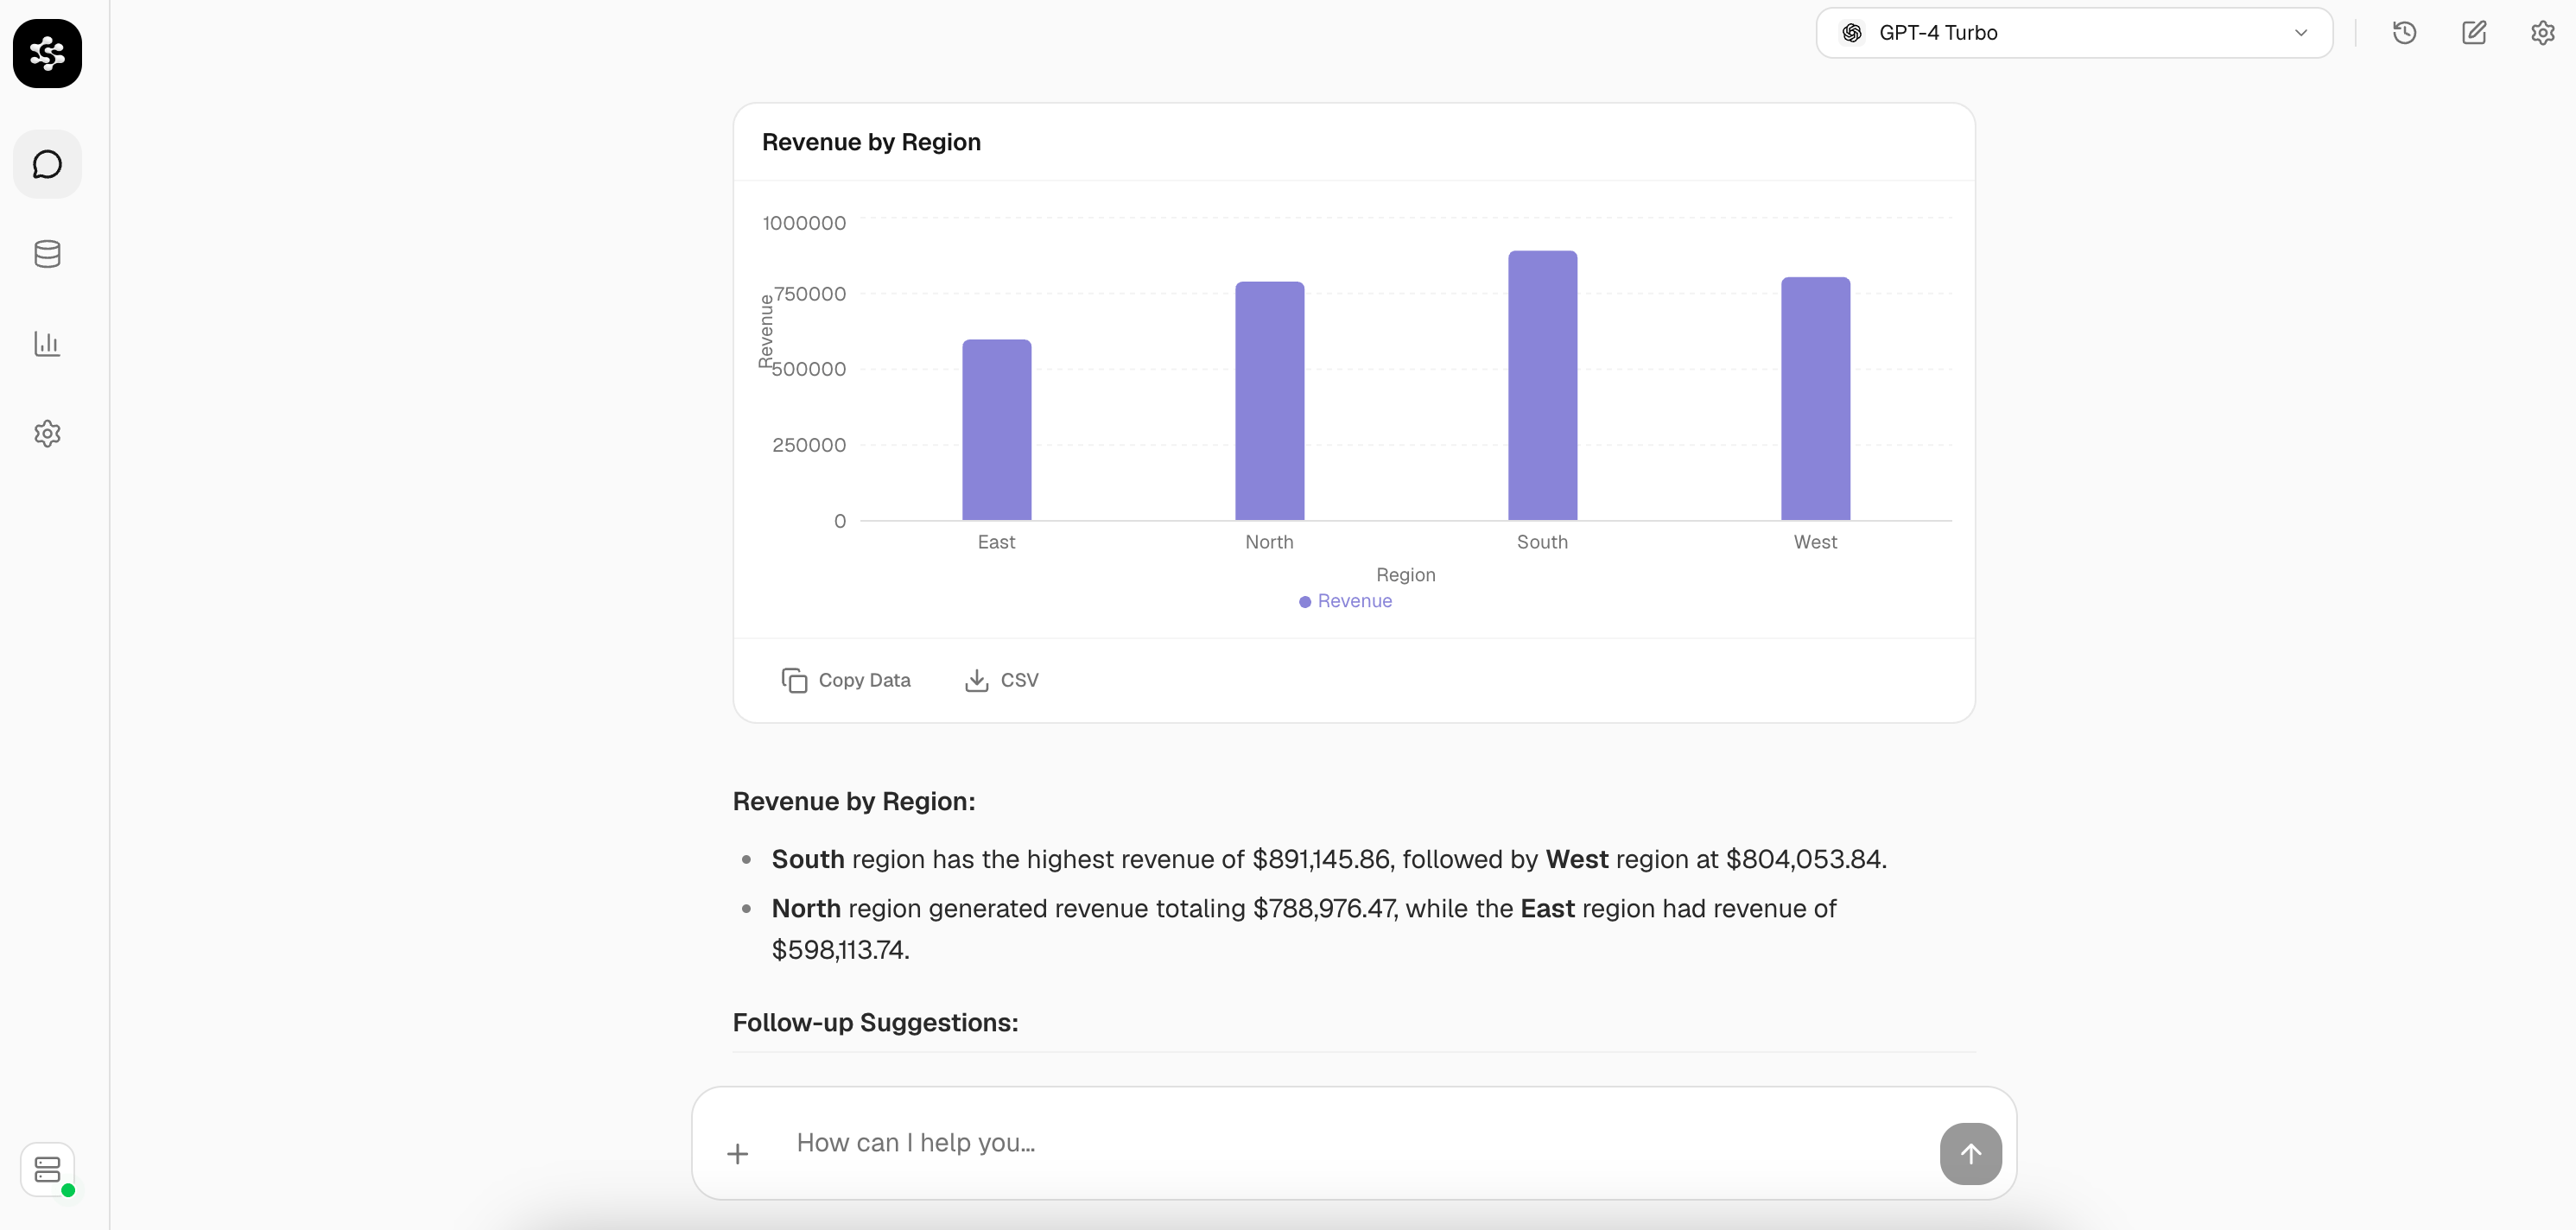
A bar chart generated in Chat from a sales dataset
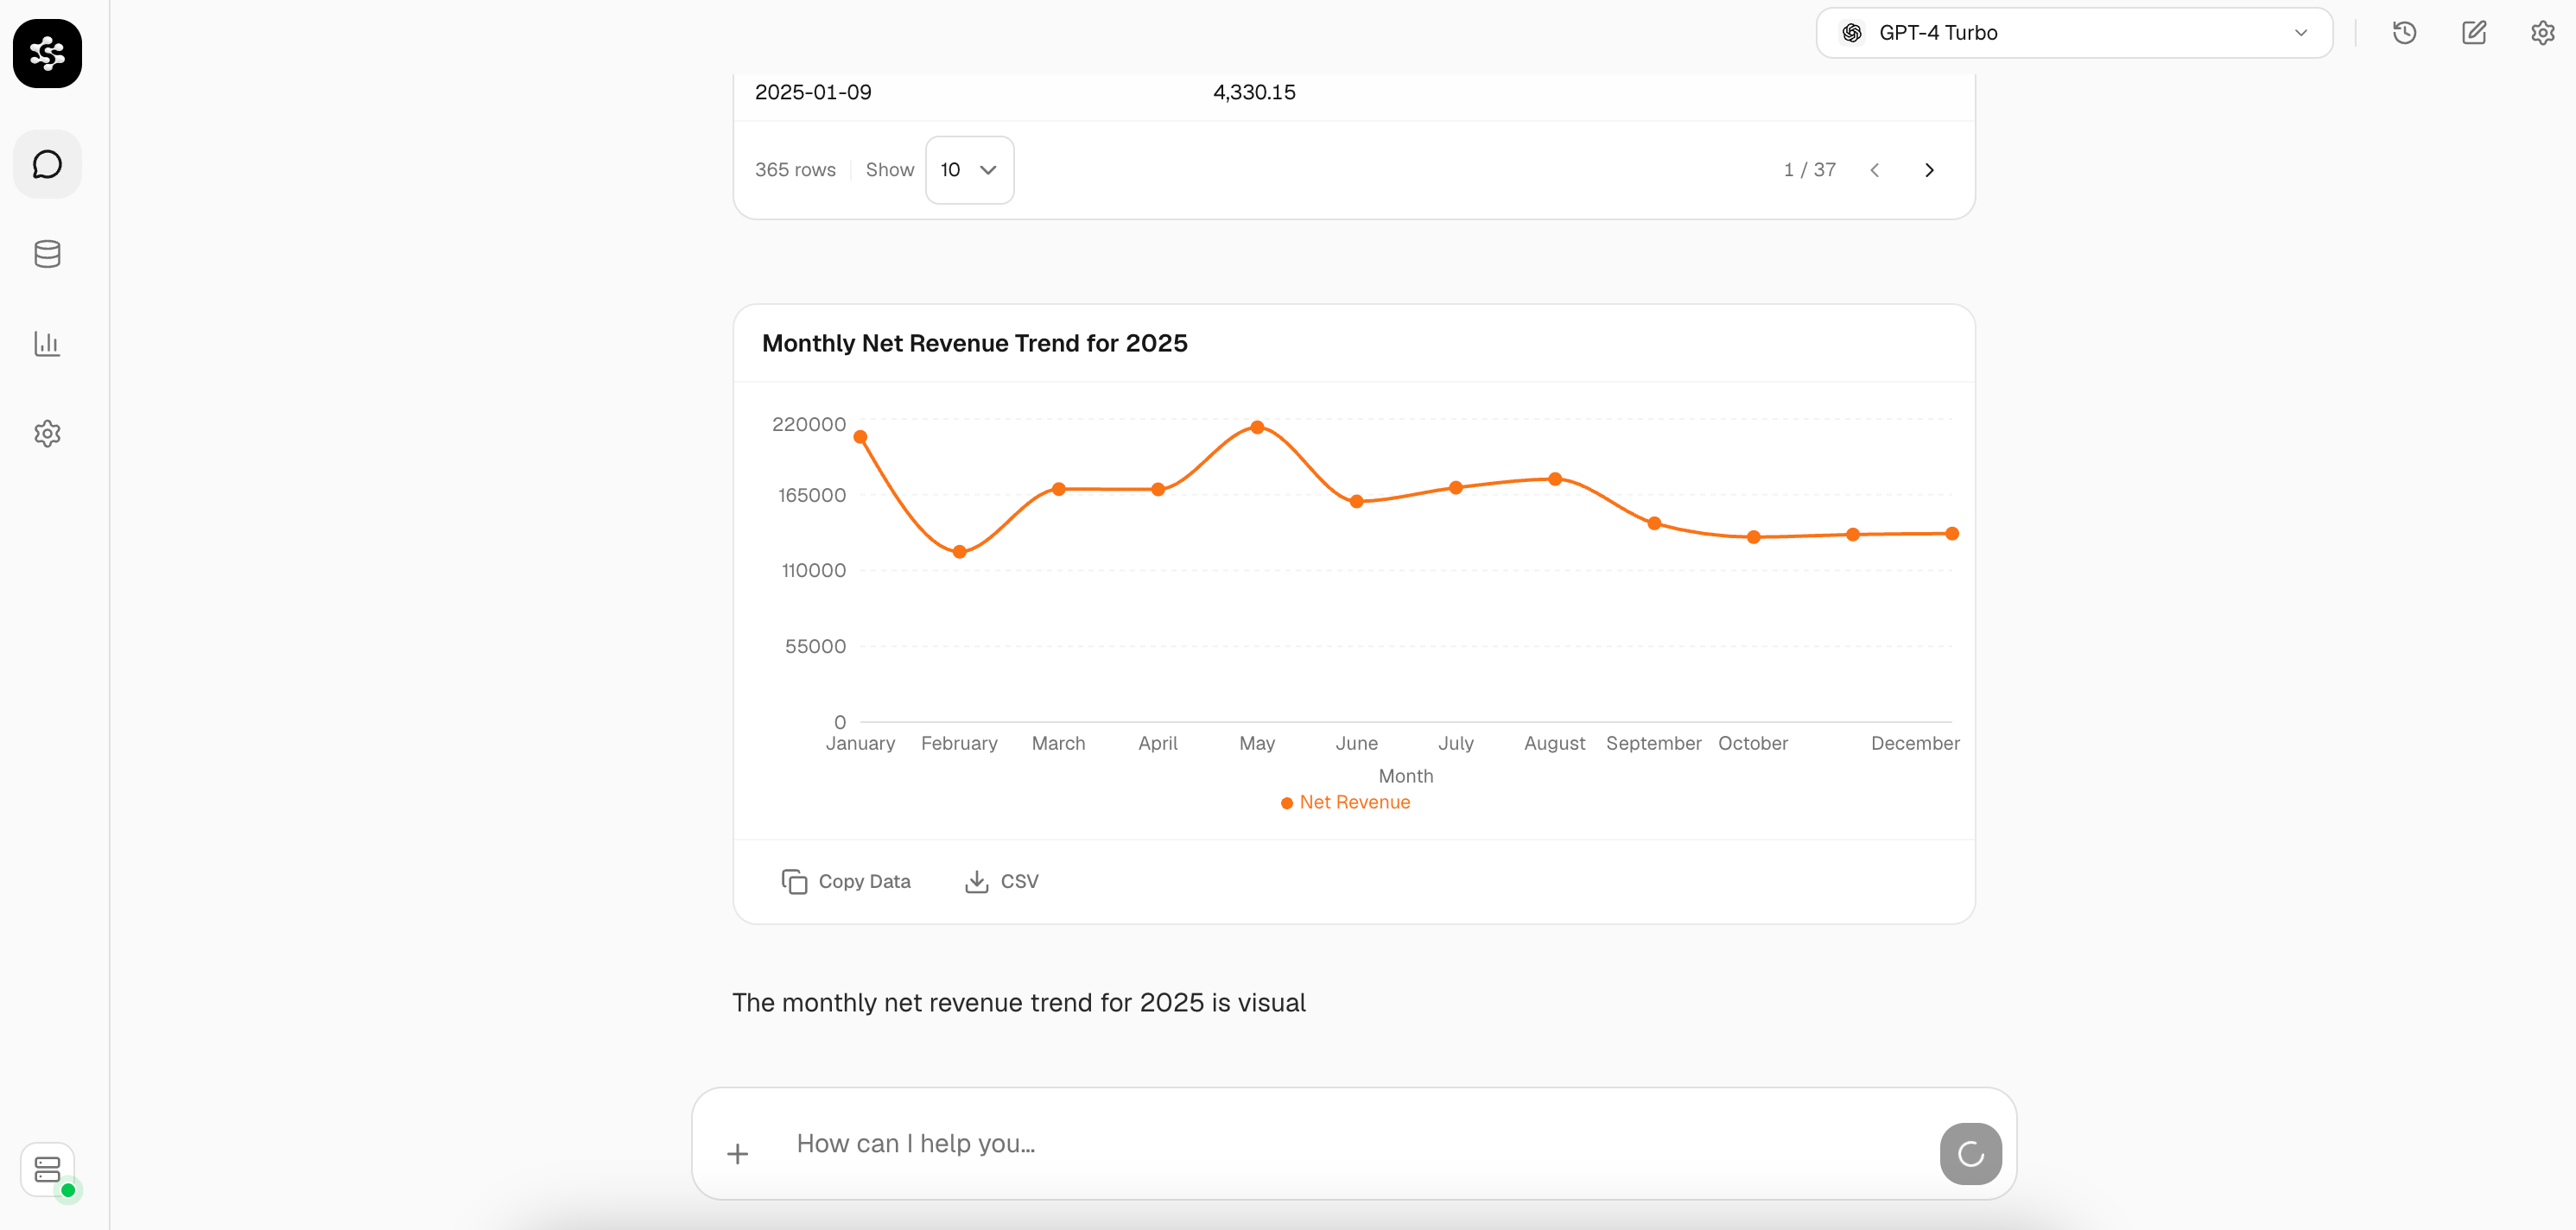
Chart with a later summary and suggestions